Monitoring Deep Learning Clusters
You can monitor Deep Learning clusters using the Ganglia monitoring service and TensorBoard, a visualization tool provided by TensorFlow. You can use it to visualize TensorFlow graph, plot quantitative metrics about the graph execution, and show additional data-kind of images that pass through it.
You can enable Ganglia or Tensor Board monitoring service on a Deep Learning cluster as described below:
Ganglia monitoring: It is supported as in other cluster types. Enable Ganglia Monitoring on the cluster UI’s Advanced Configuration > MONITORING. For more information, see Performance Monitoring with Ganglia.
TensorBoard: Follow these steps to enable TensorBoard:
Qubole has created a library (QDLpy) which enables you to write TensorFlow metrics in HDFS, which gets used by TensorBoard. Import the library by running
from qdlpy import DLD.Register a program to TensorBoard by adding this code snippet to the code:
DLD.register(['tensorboard'], "project_name")["tensorboard_hdfs_path"])Create a FileWriter using the location registered by
qdlpy.Print the session graph writer by using this code:
tf.summary.FileWriter(tensorboard_hdfs_path, sess.graph)Pass the result of evaluating any summary operation using
tf.Session.runortf.Tensor.eval.
Viewing Ganglia Metrics
In the Clusters UI page, the Resources against an Ganglia-enabled active Deep Learning cluster lists down the Ganglia monitoring.
Click Ganglia Monitoring and to check the GPU metrics on Ganglia for a specific node, follow these steps:
- Select the node IP from the Ganglia home page
- Select GPU metrics from the list of options.
- See various GPU related graphs such as GPU memory in use, utilization, and fan speed.
Viewing TensorBoard Metrics
In the Clusters UI page, the Resources against a TensorBoard-enabled active Deep Learning cluster lists down the Deep Learning Apps as shown here.
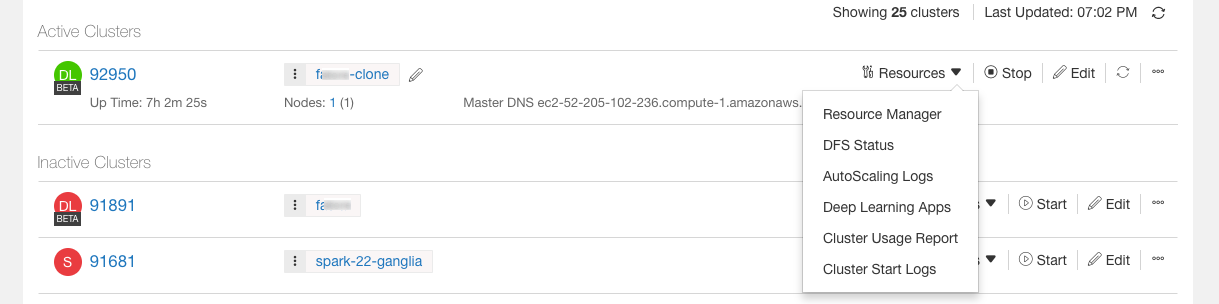
Click Deep Learning Apps to see the TensorBoard metrics. The project that you had registered using DLD contains the graphs related to that run.